One of the biggest challenges in addressing climate change is illustrated by the “boiling frog” metaphor: A frog sitting in a pot of water that is being heated gradually will not notice that it’s being boiled alive until it’s too late. Similarly, because so many of the changes caused by climate change are slow and incremental, it can be difficult to accept or recognize them before disaster strikes.
But when a Princeton University undergrad noticed that the town’s lake was no longer freezing over enough to support winter recreations that had long been popular, she saw an opportunity to help Princeton residents grasp the reality of climate change much more concretely, with implications for broader climate communications as well.
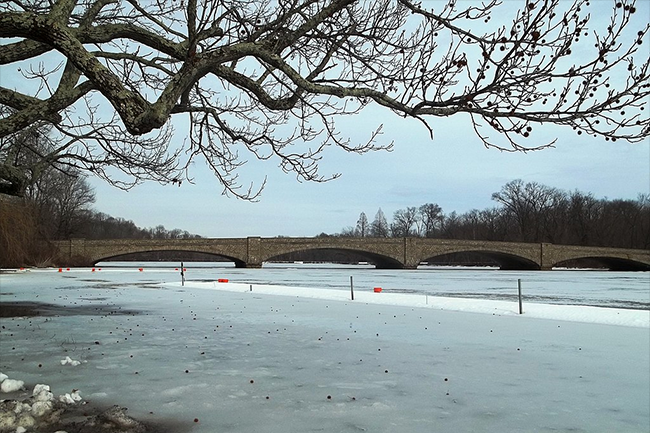
Lake Carnegie, pictured above, has been a popular winter attraction in Princeton, NJ, with large numbers of skaters gliding across its frozen surface. But since 1970, average winter temperatures have risen enough that the lake only freezes in about one in five winters, making it unsafe more often than not. This fact caught the attention of Grace Liu, who began interviewing longtime residents and studying records to create an archive of the lake’s ice conditions.
When her results were published in Princeton’s online alumni magazine, the comments section lit up with memories of people who had enjoyed the winter scene at the lake over the years. The connections that people had to those memories were so personal and meaningful that Liu wondered whether a loss of this kind could help people recognize the effects of climate change in their actual lives. This question prompted her to begin a study that was recently published in the journal Nature Human Behavior, and her findings were that stark binary illustrations of climate impacts can help make them more real and break through climate apathy.
The simple binary graph she presented- the lake freezes or doesn’t freeze in certain years- was more meaningful and clearer than one with plot points showing gradual changes over time, and led people to more directly connect the change to a warming climate overall, rather than factors that might affect a particular year’s data. This suggests that when thinking about how to talk about climate change, presenting stark differences with personal significance to communities may have much more impact than highlighting gradual changes, even if they result in similar effects. Grace Liu’s study could have important implications for the use of data visuals that illustrate stark changes as well, and become an important tool to help people understand why climate action is crucial for the future of human thriving.
You can read mor about this on the Grist.org website here.